Sunday, August 07, 2005
Holy Crap! or, I didn't know you could do that
As a lower priority project I've been looking for a "universal UI" for any Lisp projects I may do. I've been restricting it to Web clients backed by Lisp on the server, no unusual installs, etc. I also want to keep it to something that would work with most browsers and OS's today (ruling out Safari's canvas tag, SVG, etc.) but that would allow some graphics, probably charts.
I was originally thinking of Laszlo, which with version 3.0 you can take your Laszlo client and compile it into Flash. The standalone Flash app can send requests back to the server, get data in the form of XML and use XPath strings to get to the data.
Then I found this article on JavaScript Graphics.
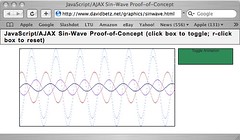
This is just browser, no Flash, Java or plugins. Basically, you can use pure JavaScript, DOM and CSS to make graphcs in browsers. All the tricks work with standards compliant browsers, and some work with IE. I've tried them with Safari and Firefox.
I was going to go Laszlo, but I won't mind going back to the drawing board for this.
I was originally thinking of Laszlo, which with version 3.0 you can take your Laszlo client and compile it into Flash. The standalone Flash app can send requests back to the server, get data in the form of XML and use XPath strings to get to the data.
Then I found this article on JavaScript Graphics.
This is just browser, no Flash, Java or plugins. Basically, you can use pure JavaScript, DOM and CSS to make graphcs in browsers. All the tricks work with standards compliant browsers, and some work with IE. I've tried them with Safari and Firefox.
I was going to go Laszlo, but I won't mind going back to the drawing board for this.
# posted by Richard Cook @ 8:08 PM 
Comments:
<< Home
You might also be interested in this library:
http://www.walterzorn.com/jsgraphics/jsgraphics_e.htm
Vector graphics in pure javascript.
Chris Double.
http://www.walterzorn.com/jsgraphics/jsgraphics_e.htm
Vector graphics in pure javascript.
Chris Double.
# posted by  : 9:57 PM
: 9:57 PM
Chris,
Thanks, I had a look at it. It seems more "fully baked", and has a license on it, but for some reason when it prints each figure comes out as one dot, while David Betz's stuff actually prints.
Anonymous,
Yes, Javascript is powerful, some have described it as Common Lisp in a different syntax. I just didn't think it was capable of graphics in a browser.

Glad you liked my (unedited) article. As a related item, I just started a new blog about browser dynamics up at www.davidbetz.net/dynamicbliss/. You may want to check that one out.
Post a Comment
<< Home
![]()